Introduction to Logs
Logs are pages within each project (workspace) that expose detailed operational records, allowing investigation of specific events and monitoring of workspace activity.
What are Logs?
Logs are detailed pages that complement the analytics dashboard, providing granular access to specific events and activities within the workspace. While the dashboard offers an aggregate view through graphs and metrics, the Logs allow investigation of each event individually.
Through the Logs, you can:
- Investigate specific events: Access detailed information about conversations, evaluations, and executions
- Monitor activity: Track platform usage at an operational level
- Analyze quality: Identify patterns, issues, and improvement opportunities
- Audit actions: Have complete traceability of workspace activities
Accessing the Logs
To access the Logs:
- Navigate to the Projects section in the side menu
- Select the desired project
- In the project’s side menu, you will find log options just below the Dashboard:
- Conversations
- Response Evaluation
- Metrics and Events
Conversations
The Conversations section lists all conversations conducted by users of the workspace.
What you will find:
- Complete list of conversations: All interactions with workspace assistants
- Detailed information: For each conversation, you will see:
- Assistant used
- Participants in the conversation
- Start and end date and time
- Duration of the conversation
- Status (active, completed, etc.)
- Complete view: When opening a conversation, you can:
- View the full message history
- See the context and prompts used
- Export logs for auditing and analysis
Use Cases:
- Auditing: Track all user interactions
- Usage Analysis: Understand how assistants are being utilized
- Support: Access specific conversations to assist users
- Continuous Improvement: Identify usage patterns and user needs
Response Evaluation
The Response Evaluation section centralizes all feedback provided by users regarding the responses from assistants.
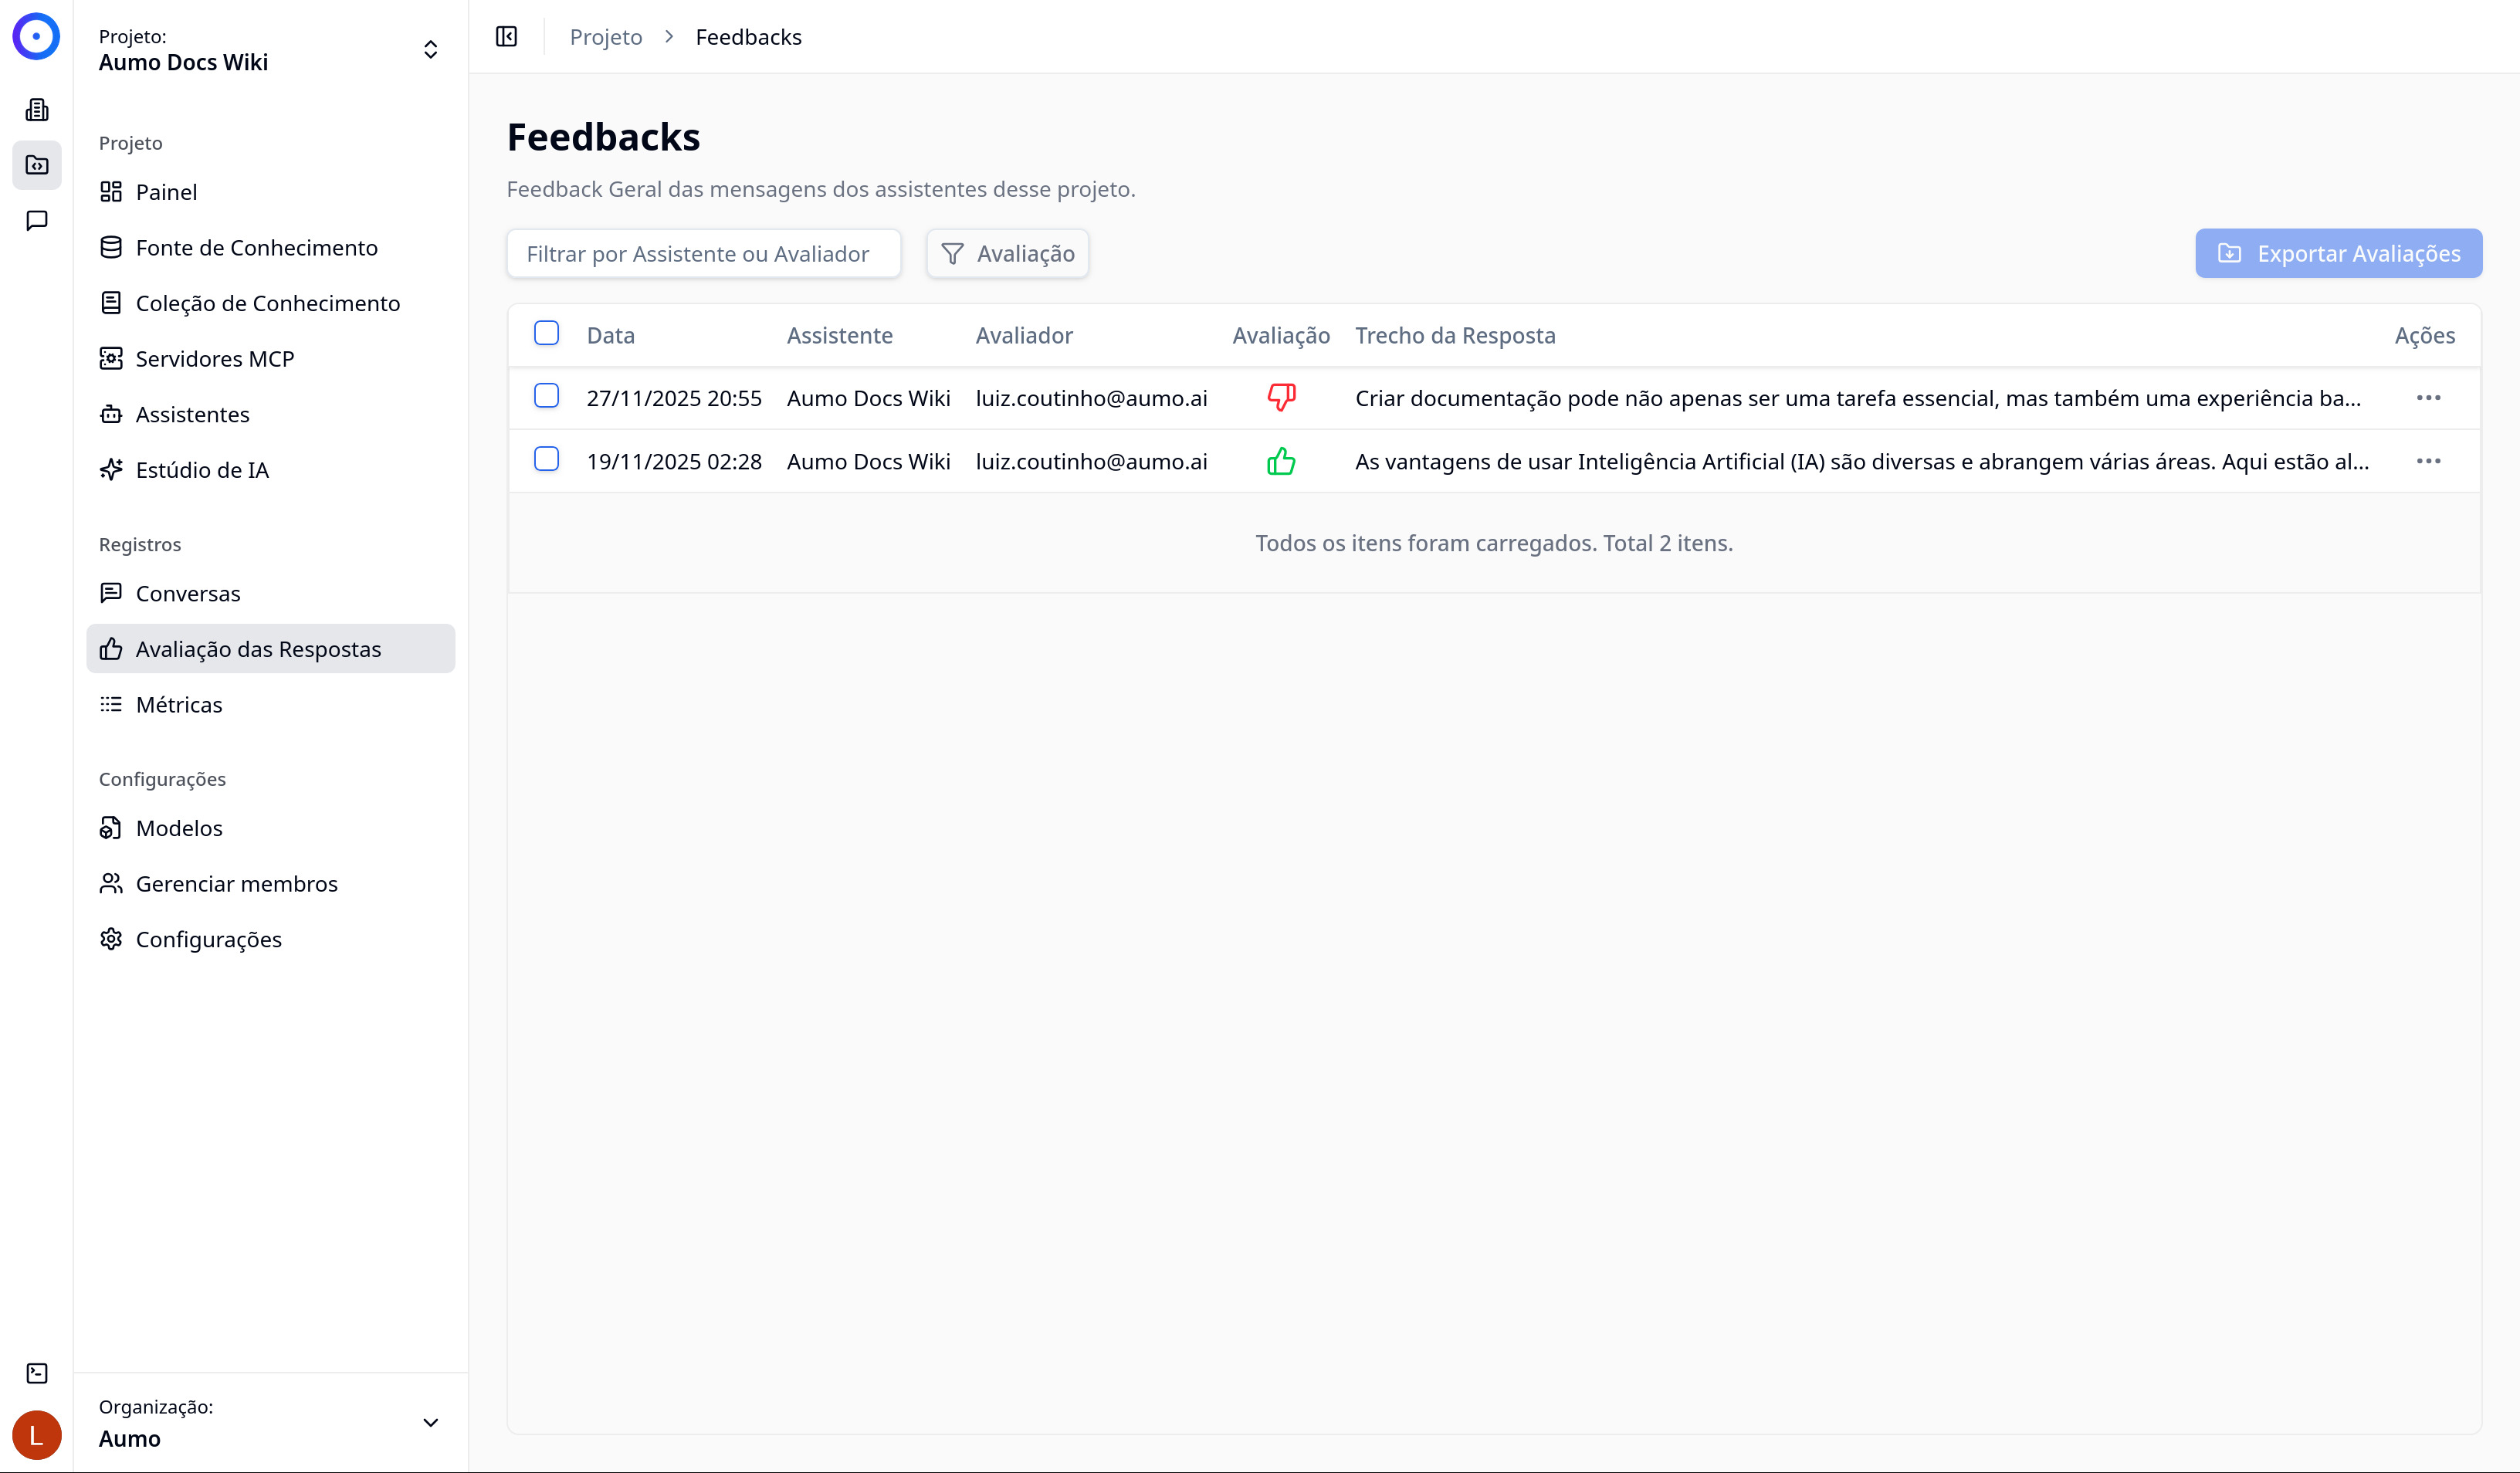
What you will find:
- Positive and negative feedback: Evaluations with 👍 (positive) and 👎 (negative)
- Complete context: For each evaluation, you will see:
- The prompt submitted by the user
- The response generated by the assistant
- Additional user comments (when available)
- Evaluation date and time
- Assistant used
- Aggregate analysis: Visualize satisfaction trends and feedback patterns
Use Cases:
- Quality Improvement: Identify responses that need to be enhanced
- Gap Identification: Discover questions that assistants cannot answer well
- Prompt Optimization: Use feedback to adjust prompts and settings
- Training: Identify areas where assistants need more knowledge
Metrics and Events
The Metrics and Events section chronologically records all executions and operational events of the workspace.
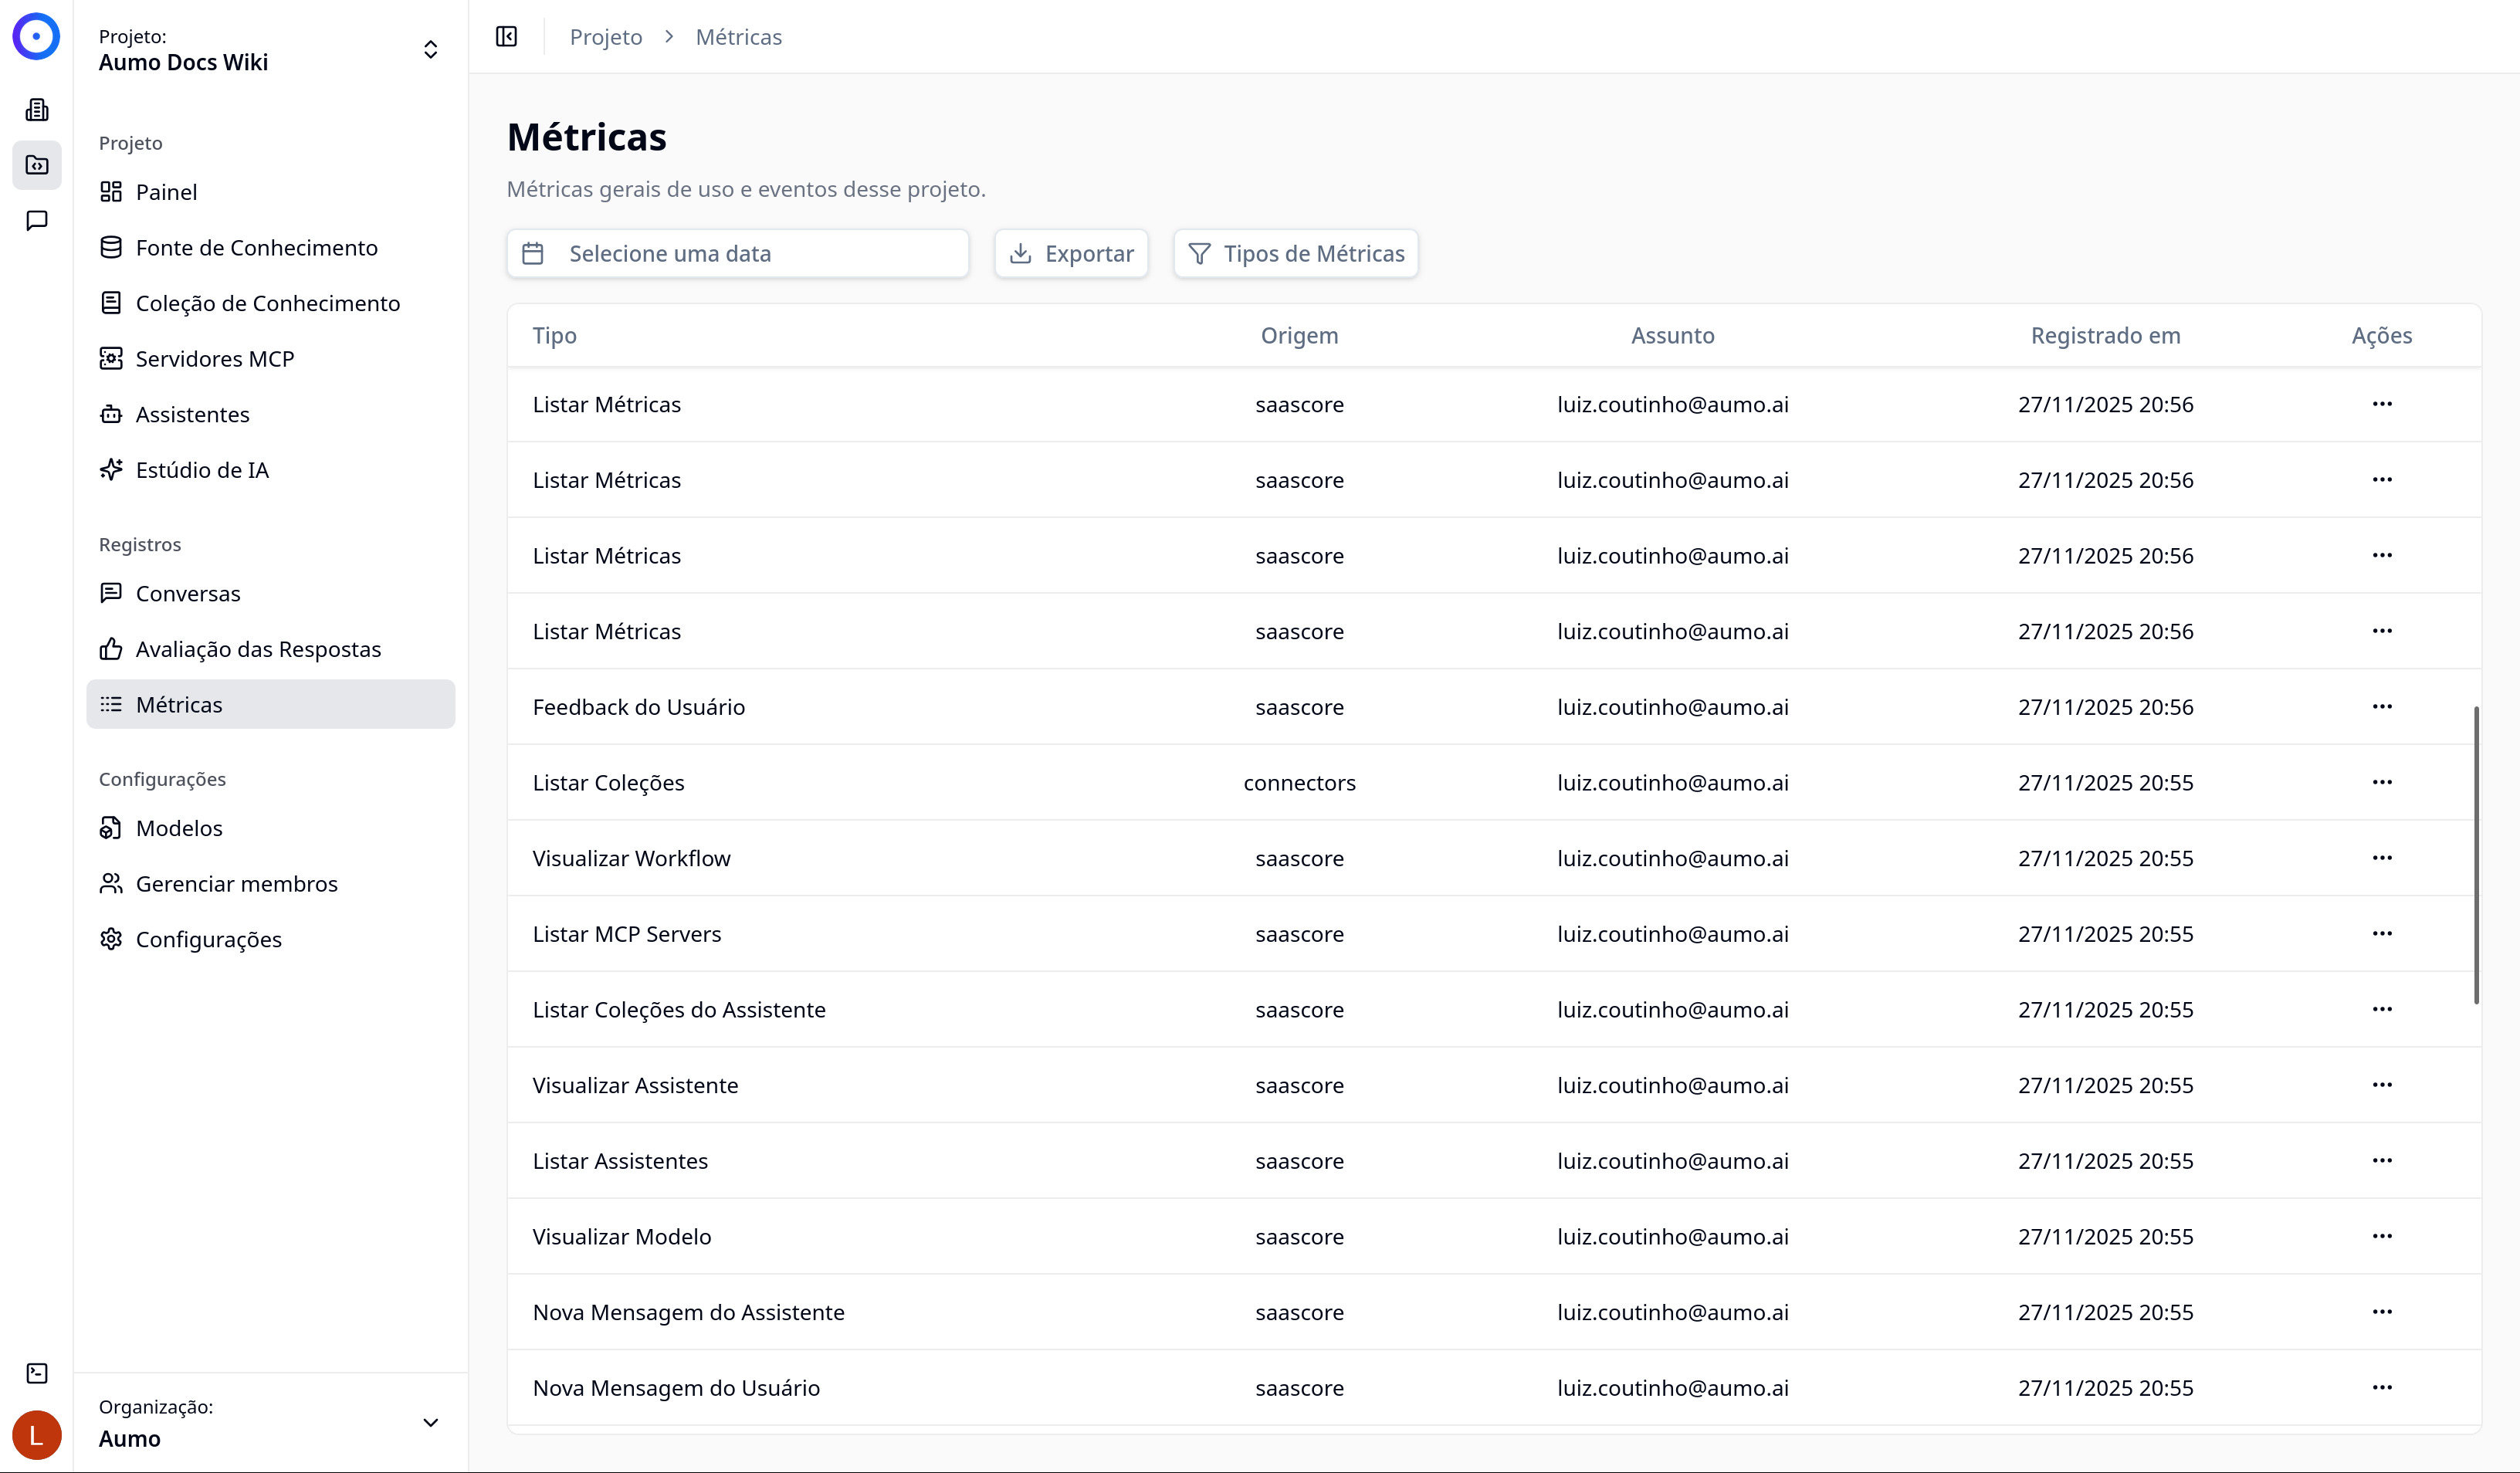
What you will find:
- Chronological record: Events ordered by date and time
- Types of recorded events:
- Assistant executions
- File uploads
- Knowledge source synchronizations
- Calls to MCP servers
- Other system events
- Details of each event:
- User responsible for the action
- Execution time
- Status (success, error, etc.)
- Error messages (when applicable)
- Resources used
Use Cases:
- Operational Monitoring: Keep track of the workspace's health in real-time
- Incident Investigation: Identify the root cause of issues
- Performance Optimization: Identify slow or problematic operations
- Usage Analysis: Understand which resources are most utilized
- Security Audit: Track all actions taken in the workspace
Integration with the Dashboard
Logs work in conjunction with the Dashboard:
- Dashboard: Provides an aggregate view and trends through graphs
- Logs: Provide specific details and allow in-depth investigation
Use the Dashboard to identify trends and patterns, and the Logs to investigate specific events and understand the detailed context.
Next Steps
- Explore the different log sections available
- Combine information from the Dashboard with the Logs for complete analyses
- Export data when necessary for external analyses or audits